Operating a server
Overview and metrics
A server's Overview puts what needs you first, then live metrics, its apps and recent activity. Every number comes from the kernel's own interfaces, never from scraping a tool's output.
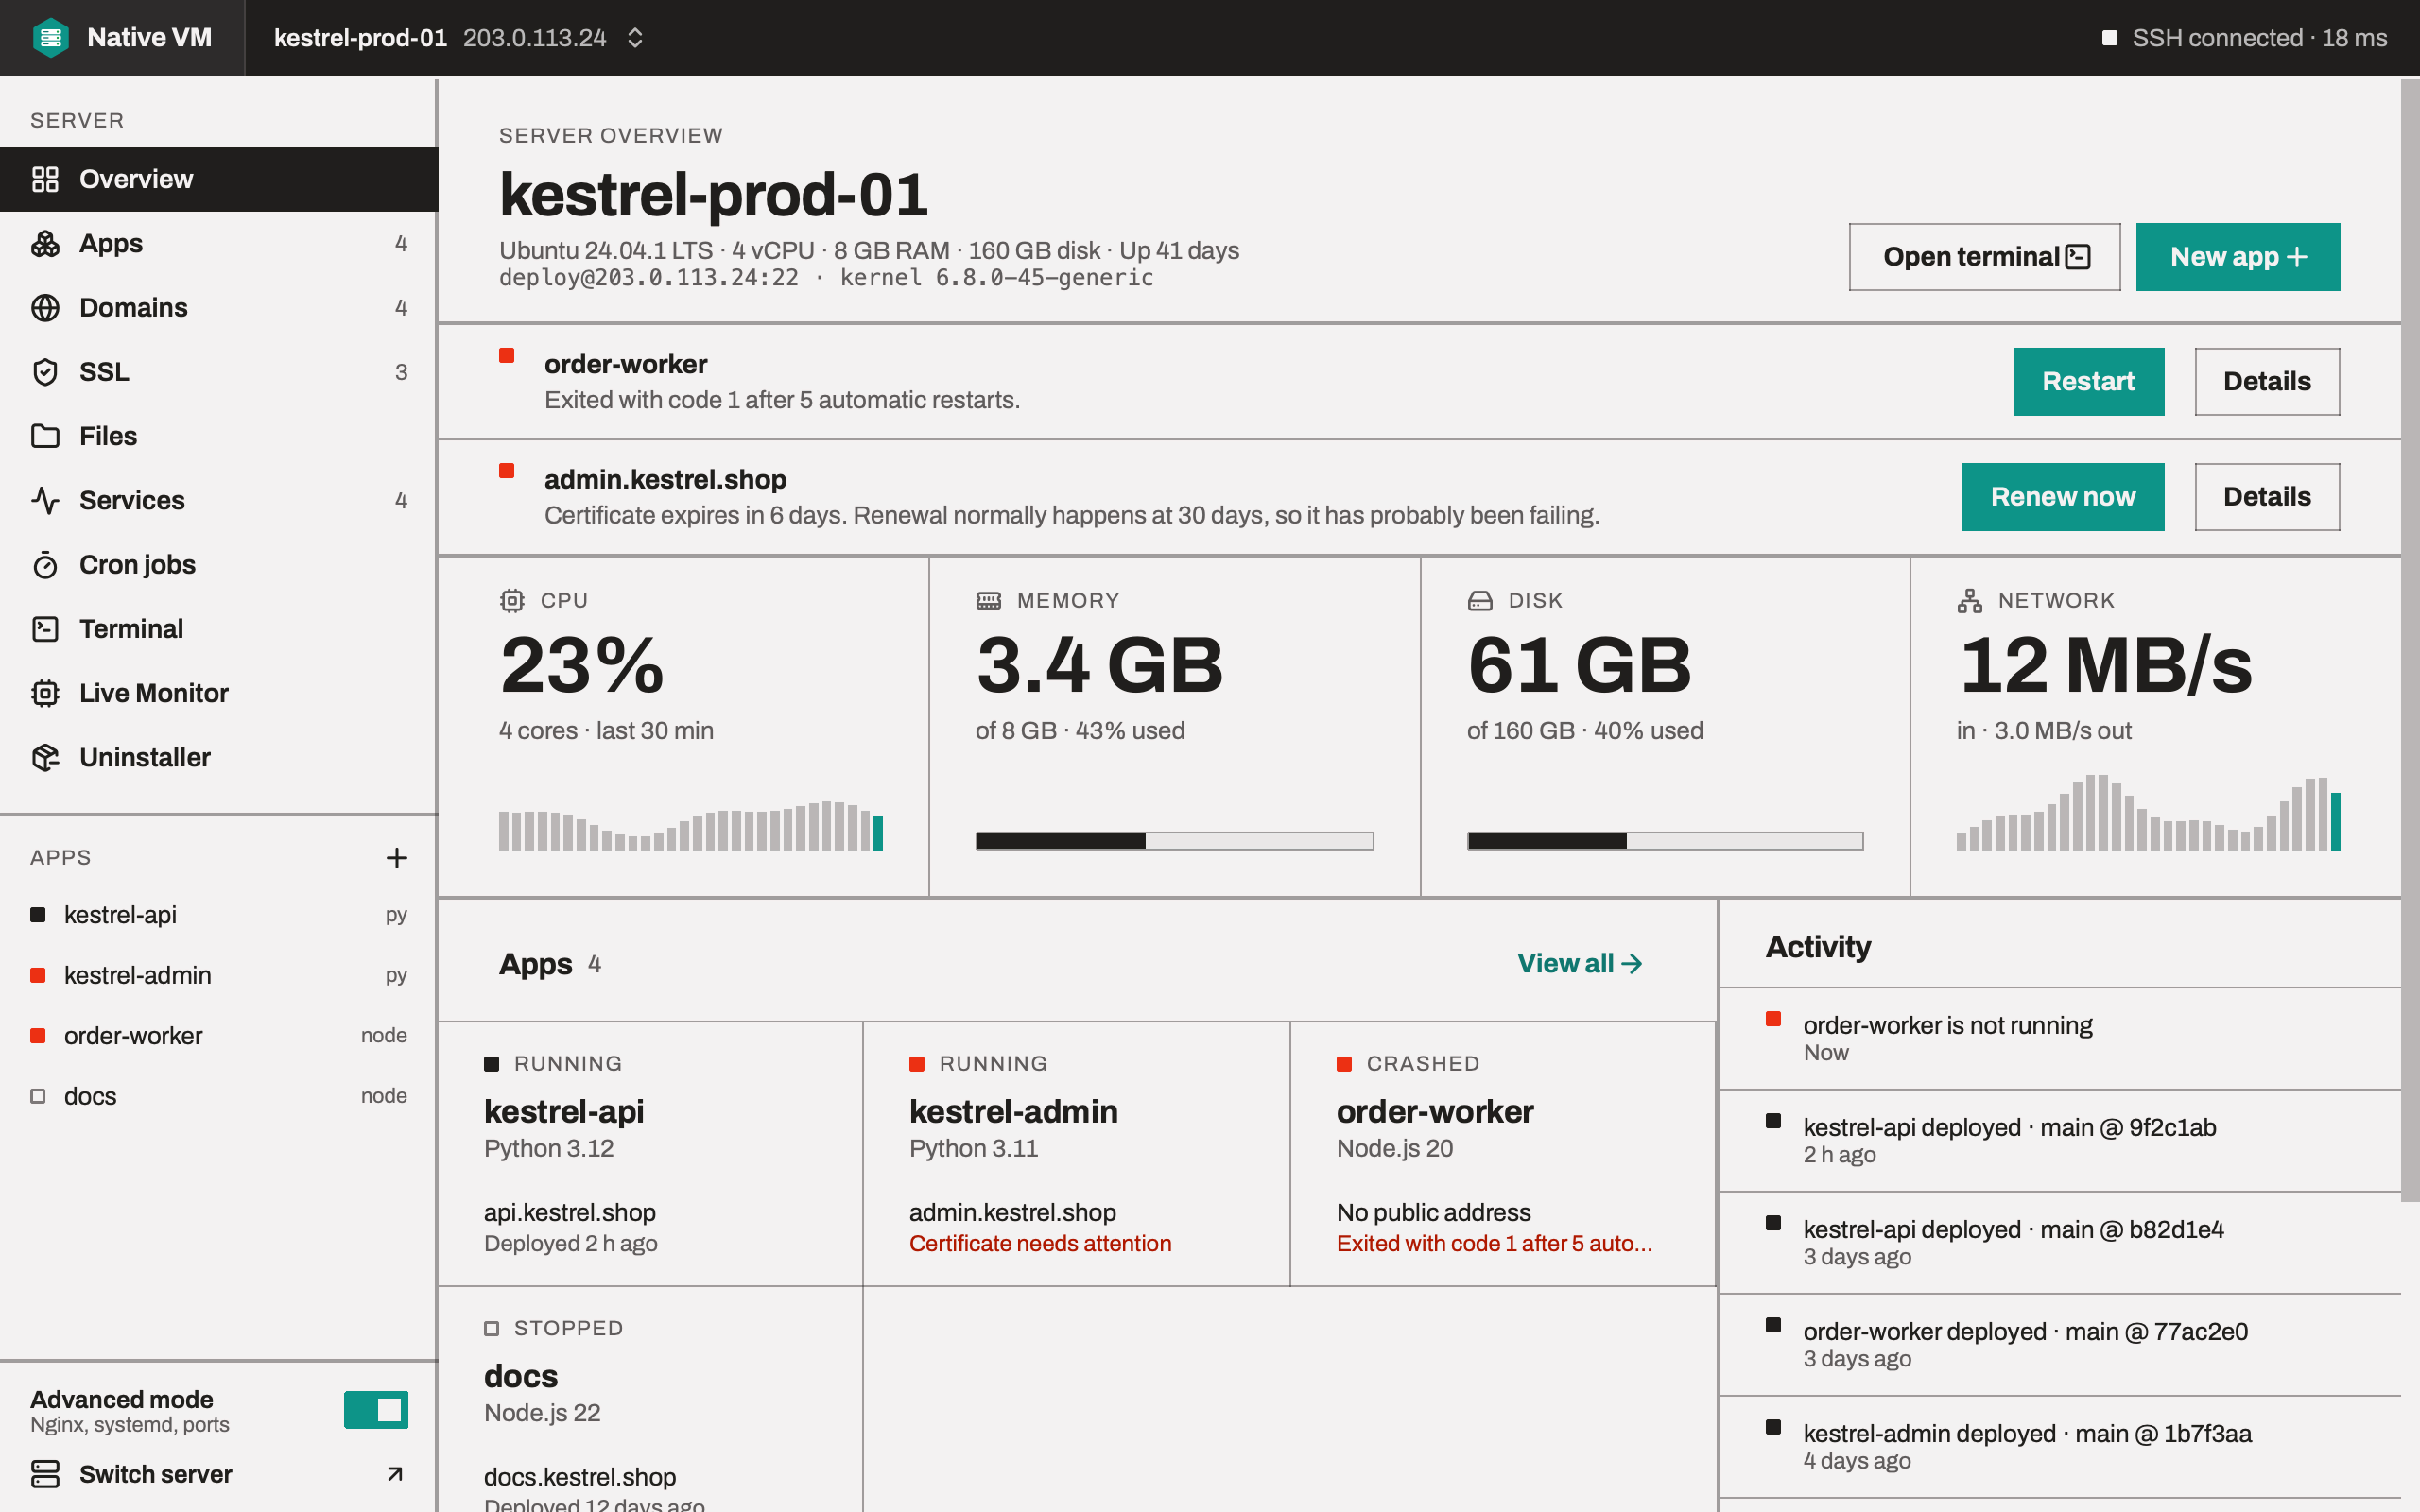
The header
The server's name, then its system: distribution, processors, memory, disk and uptime, and the user, address and kernel it's reached on. Open terminal and New app sit beside them.
Needs attention
Anything that needs you is listed first, with the button that fixes it:
- an app that has crashed or failed, with Restart and Details;
- a certificate close to expiry, with Renew now.
Live metrics
| Meter | What it shows |
|---|---|
| CPU | Use across all cores. Time waiting on disk counts as idle: a core waiting isn't working. |
| Memory | Used memory, measured with the kernel's own estimate of what's available. |
| Disk | Used space on the main disk, measured against what you can actually fill, as df does. |
| Network | Traffic in and out on the main interface. |
The sparklines under CPU and Network are per-minute averages over the last 30 minutes. Until there are 30 minutes of history, they're labelled since you connected.
- Rates need two samples. CPU, network and disk counters count from boot, so the first poll after connecting can't show a rate, and the meter says so rather than drawing a flat line.
- Pseudo filesystems and loop devices are left out: a tmpfs isn't a disk you can fill, and snap images always look full.
Polling, and backing off
Metrics are read every two seconds, in a single round trip per poll. When polls take more than a quarter of the interval, on a slow or distant server, Native VM widens it and the header says backed off, then narrows it again step by step as polls recover. A slow server never has two polls in flight.
History begins when you connect
Native VM collects nothing while it's closed, so history starts when you open a server. It keeps up to six hours of samples per server for the session, and yesterday's samples never appear. The Servers window says so in as many words.
Apps and activity
The Apps cards show each app's state, runtime, address and last deploy. Activity is built from what the server records, such as release times and certificate dates, plus this session's actions.
The Overview refreshes every 30 seconds and after every action you take, so what you see is never older than your last change.